Synthesis and characterization of Cur-Fe and CF@EM
Cur-Fe was synthesized by dropwise addition of curcumin (Cur) to a mixture of FeCl3 and polyvinylpyrrolidone (PVP). The obtained Cur-Fe significantly improved the solubility and dispersion of curcumin in water (Fig. S1A). The morphology of Cur-Fe was characterized using transmission electron microscopy (TEM), revealing a uniform morphology and a size of approximately 5 nm. Energy dispersive spectrometer (EDS) results showed irregular doping of a significant amount of C, O, and Fe in Cur-Fe, suggesting that these elements are the main components of Cur-Fe (Fig. 2A). X-ray diffraction (XRD) analysis further confirmed that Cur-Fe is amorphous (Fig. S1B). Fluorescence emission spectra were obtained for both curcumin and Cur-Fe at an excitation wavelength of 400 nm. The results demonstrated that curcumin exhibited remarkable fluorescence at 520 nm, whereas Cur-Fe showed significant quenching (Fig. 2B). This quenching effect can be attributed to the complexation between curcumin and the metal ion, leading to non-radiative charge transfer. Fourier transform infrared (FTIR) spectra of Cur-Fe also indicated the coordination of ferric ions with the HO-C group in curcumin, as evidenced by the reduced infrared intensity at 1150–1200 cm− 1 (HO-C stretching band) (Fig. 2C). UV-Vis results revealed that Cur-Fe exhibited a maximum absorption wavelength similar to that of Cur, as well as a characteristic absorption peak similar to that of FeCl3 (Fig. S1C). These findings collectively suggest the formation of a stable complex between Cur and iron ions in the nanomaterials. X-ray photoelectron spectroscopy (XPS) analysis was performed to determine the elemental valence state of ferric ions in the nanomaterials, which showed the coexistence of Fe2+ and Fe3+ states (Fig. 2D). To obtain CF@EM, EM was added to Cur-Fe under ultrasound. TEM results showed that a large number of black particles were visible in CF@EM (Fig. 2A), indicating that Cur-Fe was successfully encapsulated in EM. Similarly, SDS-PAGE results showed that the protein profile in CF@EM was consistent with that in EM (Fig. 2E). Dynamic light scattering (DLS) results showed that the size of Cur-Fe nanoparticles encapsulated with EM increased from 19.12 ± 1.66 nm to 200.16 ± 17.35 nm (Fig. 2F), and the zeta potential decreased from 9.28 ± 0.88 mV to -13.81 ± 0.59 mV (Fig. 2G, S1D). All these results indicated that CF@EM was successfully synthesized. Concurrently, the size of Cur-Fe and CF@EM were measured over seven days, and no significant changes were observed. This suggests that both Cur-Fe and CF@EM exhibit good stability (Fig. S1E).
Enzymatic activities of Cur-Fe
Since polyphenols are usually considered natural antioxidants, to verify the antioxidant capacity of Cur-Fe, we evaluated its enzymatic activity. O2•− is one of the common free radicals, and hypoxanthine/xanthine oxidase (HYP/XOD) can produce O2•−, because O2•− is extremely unstable and exists for a very short period, BMPO was employed as a trapping agent to capture the produced O2•− and form a more stable (BMPO/•OOH) spin adduct. Electron spin resonance (ESR) spectroscopy revealed that the O2•− produced by HYP/XOD could be effectively scavenged by Cur-Fe (Fig. 2H). Nitro-blue tetrazolium (NBT) is a commonly used O2•− tracer that reacts with O2•− to form water-insoluble formazan, and the O2•− scavenging ability can be measured by determining the absorbance of formazan at 560 nm. It was found that Cur-Fe had nearly 90% O2•− removal at a concentration of 20 µg/mL (Fig. S2). The SOD enzyme activity of Cur-Fe was evaluated by testing with a commercially available SOD assay kit. It was found that Cur-Fe has a good O2•− scavenging ability with an enzyme activity of 269 U/mg (Fig. 2I). The 1,1-diphenyl-2-picrylhydrazyl (DPPH) radical, one of the widely used models in free radical scavenging assays, is a very stable nitrogen-centered radical. The results showed that a lower concentration of Cur-Fe exhibited excellent DPPH radical scavenging ability (Fig. 2J). 3,3’,5,5’-Tetramethylbenzidine (TMB) is a commonly used •OH chromogenic substrate, and the •OH generated by the Fenton reaction can oxidize the TMB to oxTMB, and the Cur-Fe can reduce the oxTMB (Fig. 2K). Similarly, 2,2′-Azinobis-(3-ethylbenzthiazoline-6-sulfonate) (ABTS) was commonly used as a chromogenic substrate to detect the scavenging effect of ROS as a function of the total antioxidant capacity of the nanoparticles. The results showed that Cur-Fe with a lower concentration (5 µg/mL) could scavenge ~ 80% ROS, thus exhibiting excellent antioxidant capacity (Fig. 2L).
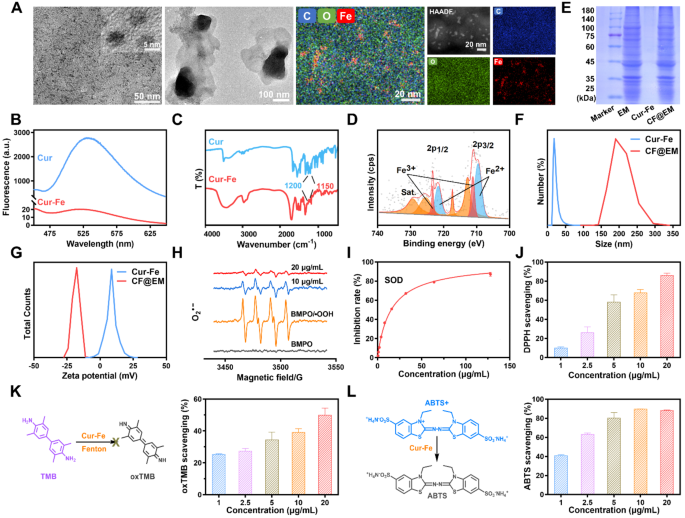
Characterization and ROS scavenging activities. (A) TEM images of Cur-Fe and CF@EM. The image on the right shows the element mapping of Cur-Fe. (B) The fluorescence of curcumin and Cur-Fe. (C) FTIR of curcumin and Cur-Fe. (D) XPS of Cur-Fe. (E) SDS-PAGE protein analysis of EM, Cur-Fe, and CF@EM. (F) Particle size distribution of Cur-Fe and CF@EM. (G) Zeta-potential of Cur-Fe and CF@EM. (H) ESR spectra of BMPO indicating O2•− scavenge with Cur-Fe. (I) SOD assay kit to determine the SOD-like activity of Cur-Fe. (J) DPPH radical scavenging ratio of Cur-Fe. (K) Schematic illustration of the TMB + •OH scavenging process and the scavenging ratio of Cur-Fe. (L) Schematic illustration of the ABTS radical scavenging process and the scavenging ratio of Cur-Fe. Data were expressed as the mean ± SD (n = 3)
The intracellular anti-inflammatory and antioxidant effects of Cur-Fe
Under oxidative stress, such as stimulation with high concentrations of H2O2, cells generate large amounts of ROS. 2,7-dichlorofluorescein diacetate (DCFH-DA) is a cell-permeable probe. It will be hydrolyzed to DCFH when it enters the cells, and non-fluorescent DCFH will be oxidized to fluorescent DCF by intracellular ROS. With H2O2 stimulation, strong green fluorescence appeared in the cells, indicating a large amount of ROS generated under the oxidative stress state. In contrast, the green fluorescence was attenuated by pretreatment with Cur and Cur-Fe (Fig. 3A). Flow cytometry results further showed that Cur and Cur-Fe significantly reduced ROS levels, and the scavenging ability of Cur-Fe was superior (Fig. 3B, S3A). To verify the O2•− scavenging ability of Cur-Fe, dihydroethidium (DHE) was used to detect intracellular O2•− levels after H2O2 treatment. Similar to DCF, a large amount of red fluorescence was produced in the cells after H2O2 stimulation, which was attenuated by pretreatment with Cur and Cur-Fe, and the scavenging capacity of Cur-Fe was superior to that of Cur (Fig. 3C). The flow cytometry results were consistent with the fluorescence images (Fig. 3D, S3B).
Excessive oxidative stress can induce oxidative damage and cell death. To verify the protective ability of Cur-Fe against H2O2-induced cellular oxidative damage, calcein-AM/PI was used to detect the cellular status. Calcein-AM can easily penetrate the cell membrane of living cells and emit strong green fluorescence, while PI can only penetrate dead cells and emit red fluorescence. After induction by H2O2, a proportion of cells died due to oxidative stress, and the number of dead cells decreased after treatment with Cur and Cur-Fe (Fig. 3E). Detection of cell viability by methylthiazolyl tetrazolium (MTT) further indicated that Cur and Cur-Fe significantly increased cell viability after induction with different concentrations of H2O2, and the protective effect of Cur-Fe on cells was more pronounced (Fig. S4). Quantification of Annexin V-FITC/PI by flow cytometry showed that Cur-Fe inhibited H2O2-induced apoptosis and thus enhanced cell viability (Fig. 3F, G).
Inflammation is often accompanied by oxidative stress in the processes associated with inflammatory diseases. Lipopolysaccharides (LPS) can induce a variety of cytokines and inflammatory mediators in vivo by activating macrophages, endothelial cells, and epithelial cells through cell signaling systems. Therefore, we used LPS to induce RAW 264.7 cells in vitro to simulate the acute inflammatory state. The relative expression of TNF-α, IL-6, IL-12, and IL-1β was determined by real-time quantitative polymerase chain reaction (qPCR). The expression of cellular inflammatory factors was found to be increased after LPS induction, whereas it was significantly decreased in both Cur and Cur-Fe groups compared with the LPS group, with expected, a more pronounced decrease in the Cur-Fe group (Fig. 3H). Similarly, the ability of Cur-Fe to scavenge LPS-induced ROS was verified by incubating a DCFH-DA fluorescent probe to detect ROS generation in cells after LPS stimulation. The results showed that the LPS group induced a higher ROS generation, while both Cur and Cur-Fe groups reduced ROS generation (Fig. S5A). Flow cytometry results showed that Cur and Cur-Fe had similar scavenging abilities for LPS-induced ROS generation (Fig. S5B, C). The complex tissue microenvironment can lead to macrophage activation and polarization into functionally distinct subpopulations, and LPS induction usually converts macrophages into M1 macrophages, which promotes inflammation [32]. The effect of Cur-Fe on macrophage polarization was verified by observing changes in cell morphology and detecting CD86 overexpression on the surface of M1 macrophages. The results of cell morphology showed that Cur and Cur-Fe inhibited macrophage morphology alteration (Fig. S6A). The results of flow cytometry similarly showed that Cur and Cur-Fe inhibited the conversion of macrophages into pro-inflammatory M1 macrophages (Fig. 3I, S6B), thereby reducing the expression of inflammatory mediators and alleviating cellular inflammation. Meanwhile, we compared the uptake of Cur-Fe and CF@EM at the cellular level. The cellular uptake of Cur-Fe and CF@EM was also compared, and the results demonstrated that the delivery of Cur-Fe by EM enhanced the cellular uptake of Cur-Fe, as indicated by the increased fluorescence intensity of CF@EM observed in the first hour. Furthermore, the fluorescence intensities of Cur-Fe and CF@EM were found to be similar at the three-hour mark, suggesting that the cellular uptake of Cur-Fe had already saturated by then (Fig. S7). The presence of EM was observed to have no impact on the efficiency of Cur-Fe uptake by cells but rather reduced the time required for saturation to be reached.
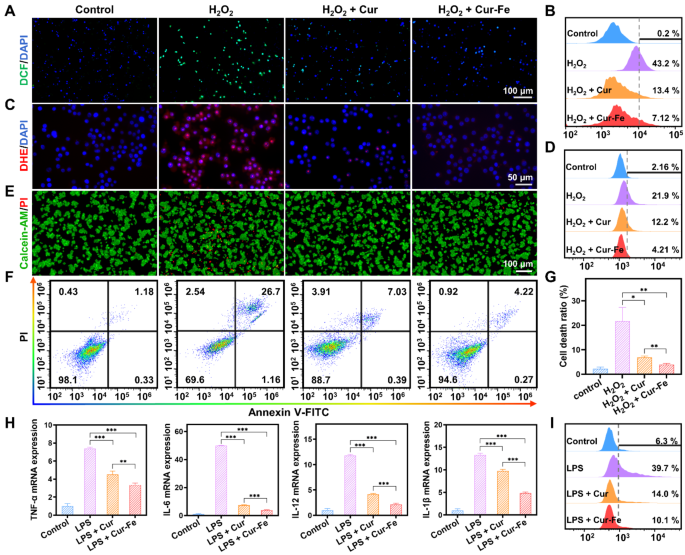
Anti-inflammatory and antioxidant effects of Cur-Fe in vitro. (A, B) Fluorescence images (A) and flow cytometry quantification (B) of DCF stained RAW 264.7 cells after different treatments. (C, D) Fluorescence images (C) and flow cytometry quantification (D) of DHE. (E) Fluorescence images of calcein-AM/PI. (F) Flow cytometry quantification of Annexin V-FITC/PI. (G) The cell death ratio was calculated based on the flow cytometry data in (F). (H) The mRNA expression of inflammatory cytokines (TNF-α, IL-6, IL-12, and IL-1β) in different groups. (I) Quantitative assessment of M1 macrophages after different treatments by flow cytometry. Data were expressed as the mean ± SD (n = 3). Statistical analysis was performed using a two-tailed Student’s t-test. *P P P
Intestinal colonization of CF@EM
Due to the complex environment of the gastrointestinal tract, oral drug delivery will encounter the degradation and absorption of drugs in the stomach and small intestine, resulting in low drug concentrations in the colon, and shortened drug residence time due to the peristaltic function of the intestinal tract, which should be the potential causes of suboptimal drug therapy. To verify intestinal colonization after Cur-Fe-coated EM, Cur-Fe and CF@EM were administered to normal mice and DSS-induced colitis mice, respectively, and then their in vivo distribution was dynamically observed. In normal mice, Cur-Fe was completely cleared from the body within 12 h, whereas CF@EM still had a strong fluorescence signal after 12 h, indicating that CF@EM was more retained in normal mice (Fig. 4A, B). Similar results were observed in the UC model. Although the altered gastrointestinal motility of the diseased mice resulted in less Cur-Fe being incompletely cleared from the body at 12 h, CF@EM still showed a strong in vivo retention capacity (Fig. 4A, C). When the isolated tissues were examined, it was found that CF@EM remained almost entirely in the intestine, with the cecum and colon regions predominating, while CF@EM distribution was not detected in other tissues and organs (Fig. 4A). Compared with the Cur-Fe group, the retention time significantly improved in the CF@EM group, and similar results were found in both the normal model and the inflammatory condition, suggesting that CF@EM has a better colonization effect on intestinal tissues (Fig. 4D).
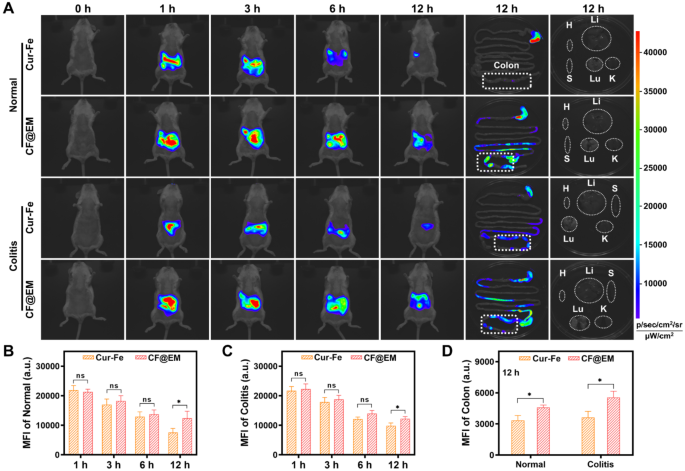
Intestinal colonization of CF@EM. (A) Fluorescence images of normal mice, DSS-induced colitis mice, colon tissues, and organs at indicated time points after oral Cur-Fe and CF@EM. H: heart; Li: liver; S: spleen; Lu: lung; K: kidney. (B, C) Quantification of mean fluorescence intensity in normal (B) and DSS-induced colitis mice (C) in vivo. (D) Quantification of mean fluorescence intensity in colon tissues of normal and DSS-induced mice. Data were expressed as the mean ± SD (n = 3). Statistical analysis was performed using a two-tailed Student’s t-test. *P P P
Biosafety assessment of Cur-Fe and CF@EM
For the in vivo use of Cur-Fe and CF@EM, appropriate biosafety evaluations should be performed. The effects of Cur-Fe and CF@EM on the viability of RAW 264.7 and FHC cells were determined by MTT. The results showed that cell viability was still around 80% after incubation of 200 µg/mL Cur-Fe or CF@EM with RAW 264.7 cells for 24 and 48 h. Similarly, the same concentration of Cur-Fe or CF@EM was incubated with FHC cells for the same time, and cell viability remained above 80% (Fig. S8A).
After oral administration of Cur-Fe and CF@EM, no significant pathological changes in mice were found in H&E staining major tissue sections (Fig. S8B). Meanwhile, red blood cells, white blood cells, lymphocytes, platelets, and hemoglobin were examined, and the results showed that there were no significant differences between mice in the Cur-Fe and CF@EM groups and mice in the control group (Fig. S8C). Similarly, to evaluate the changes in biochemical indices, alanine aminotransferase (ALT) and aspartate aminotransferase (AST) were used as liver function evaluation indices, and creatinine (CRE) and urea were used as renal function indices, and it was found that both Cur-Fe group and CF@EM group showed no significant differences compared with the control group (Fig. S8C). It was demonstrated that both Cur-Fe and CF@EM had good biosafety.
Therapeutic efficacy of CF@EM in DSS-induced colitis
Based on the intestinal colonization effect of CF@EM and the anti-inflammatory and antioxidant effects of Cur-Fe, we evaluated the therapeutic effect of CF@EM in a DSS-induced ulcerative colitis model. Based on the results of the biosafety assessment, we decided to administer Cur-Fe and CF@EM at a dose of 30 mg·kg− 1. To better evaluate the therapeutic effect of CF@EM, we selected 5-aminosalicylic acid (5-ASA), a clinically used therapeutic drug, as a positive drug control group. At the end of 7 days of modeling, drug treatment was administered for 5 consecutive days (Fig. 5A). The results showed that the mice in the control group showed a trend of slow increase in body weight and no significant change in disease activity index (DAI), while the DSS group showed a gradual decrease in body weight with the progression of the disease, and the DAI was maintained at a high level after continuously increasing, indicating that the disease progression was more serious. Compared with the DSS group, the remaining four groups showed a moderation in the degree of weight loss and increase in DAI, especially the 5-ASA group and the CF@EM group showed a rebound in body weight and a significant decrease in DAI after treatment, indicating that the disease was effectively controlled (Fig. 5B, C). Endoscopic examination of the mice revealed that the intestinal mucosa of mice in the DSS group showed diffuse ulceration with hemorrhage, and the intestines were significantly improved after treatment with CF@EM, and the effect was superior to that of Cur-Fe. The evaluation of spleen index and colon length showed that the CF@EM group could significantly reduce the spleen index and restore the colon length, which was not significantly different from that of the 5-ASA group, while the simple Cur-Fe group had some therapeutic effect, but the efficacy was limited (Fig. 5D-F). In the H&E staining of the colon, it could be seen that all the epithelial cells and crypts were destroyed in the DSS group, and also showed obvious inflammatory cell infiltration; the Cur and Cur-Fe groups preserved part of the crypts and epithelial cell structure, and the lesion area was reduced. The CF@EM group significantly reduced the pathological damage of the colon (Fig. 5F). By myeloperoxidase (MPO) detection, it was found that both Cur-Fe and CF@EM could reduce the MPO level, and the effect of CF@EM was more significant (Fig. 5G). As the disease progresses, mice with more severe symptoms may die. Therefore, the survival rate of each group was counted. It was found that except for the 5-ASA group and the CF@EM group, the survival rates of the other groups modeled by DSS were reduced (Fig. 5H).
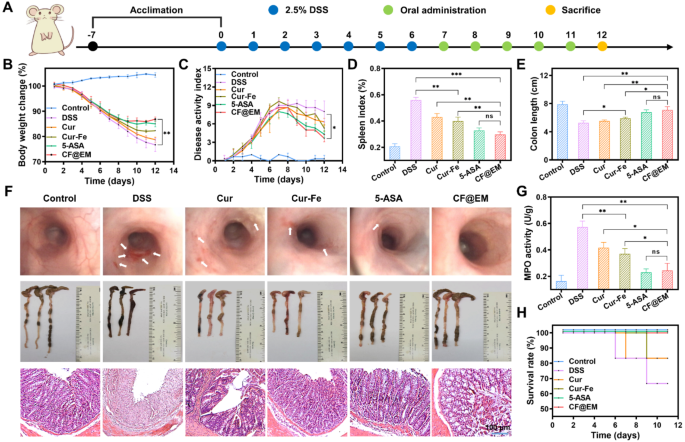
Therapeutic efficacy of CF@EM in DSS-induced colitis. (A) Schematic illustration of the establishment and treatment of DSS-induced colitis mice. (B, C) Weight change curves (B) and DAI curves (C) of mice within 12 days. (D) The spleen index of mice in different treatment groups. (E) The length of the colon. (F) Endoscopic images, colon images, and H&E staining of mice in different treatment groups. (G) The MPO activity of mice. (H) The survival rate of mice in different treatment groups. Data were expressed as the mean ± SD (n = 3). Statistical analysis was performed using a two-tailed Student’s t-test. *P P P
CF@EM relieves inflammation and restores intestinal barrier function
The production of inflammatory cytokines is very important in the development of colitis. The detection of pro-inflammatory cytokines revealed that TNF-α, IL-6, IL-1β, and IL-12 were highly expressed in the DSS group, whereas Cur-Fe and CF@EM reduced the expression of pro-inflammatory cytokines, and the anti-inflammatory effect of the CF@EM group was significantly superior to that of Cur-Fe. The CF@EM group showed the same anti-inflammatory capacity compared with the 5-ASA group (Fig. 6A-D). Inflammatory cell infiltration is usually one of the tissue features of colitis, and by immunofluorescence staining for CD86, a surface marker of M1 macrophages, we observed a large amount of red fluorescence in the colon of the DSS group. The expression of CD86 in the colon was dramatically downregulated after Cur-Fe and CF@EM interventions (Fig. 6E). These results suggest that Cur-Fe and CF@EM can modulate macrophage polarization and reduce M1 macrophages that promote inflammatory responses, which helps to slow down the development of colitis.
ROS typically accumulate in large amounts at sites of inflammation and cause oxidative damage to cells. Fluorescence staining with DHE was performed to evaluate O2•− generation in colon tissues. The results showed that obvious red fluorescence was observed in the DSS group, indicating that DSS induced the generation of a large amount of O2•−, whereas the fluorescence intensity was attenuated in the Cur-Fe group and the CF@EM group, and O2•− was effectively removed (Fig. 6F). These results suggest that CF@EM can alleviate tissue damage during the development of colitis by reducing intestinal ROS levels.
The intestinal barrier is an important barrier that prevents harmful substances and pathogens from entering the body and maintains intestinal homeostasis [33, 34]. The paracellular permeability of the intestinal barrier depends on tight junctions (TJ) between cells. By immunofluorescence staining of three tight junction proteins, occludin, ZO-1, and claudin-1, we observed the changes in tight junctions after different treatments. It was found that the fluorescence of all three tight junction proteins was weak in the DSS group and increased slightly after Cur-Fe intervention. In contrast, the fluorescence intensity was restored to almost normal levels in the CF@EM group (Fig. 6G), indicating that CF@EM can improve intestinal barrier function by restoring intercellular tight junctions.
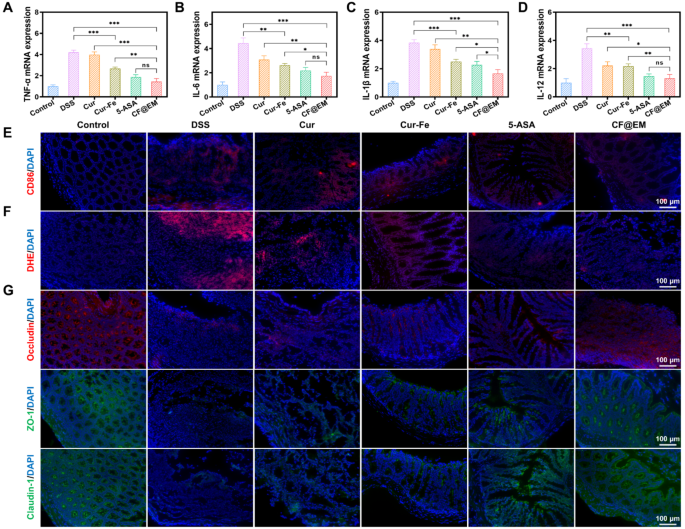
CF@EM relieves inflammation and restores intestinal barrier function. (A-D) The mRNA expression of TNF-α (A), IL-6 (B), IL-1β (C), and IL-12 (D) in different groups. (E) Evaluation of the M1 macrophage in the colon of the colitis mice after the treatment. (F) Fluorescence images of DHE. (G) Immunofluorescence image of tight junction protein (occludin, ZO-1, and claudin-1). Data were expressed as the mean ± SD (n = 3). Statistical analysis was performed using a two-tailed Student’s t-test. *P P P
Preventive effect of CF@EM in DSS-induced colitis
To further validate the preventive effect of CF@EM, four groups of mice were intermittently administered different preparations of the intervention over 7 days of oral DSS modeling (Fig. 7A). The results were as expected, with rapid weight loss and higher DAI scores in the DSS group, indicating faster disease progression and more severe symptoms. In contrast, the CF@EM group had almost no significant change in body weight and lower DAI scores, which were significantly different from the DSS group (Fig. 7B, C). Observation of feces and endoscopy revealed that the DSS group had dilute liquid-like feces with obvious bleeding. The intestinal mucosa had multiple ulcers and was significantly shorter in length. Fecal status and ulceration were significantly improved after intervention with various agents, along with some restoration of spleen index and colon length. In particular, the severity of colitis in mice was almost maintained at a milder level in the presence of CF@EM. There were significant differences compared with both Cur-Fe and 5-ASA groups (Fig. 7D-F). H&E staining revealed that the colonic crypts and epithelial cell structure were less damaged in the CF@EM group, further confirming that CF@EM had a beneficial effect on inhibiting the development of colitis (Fig. 7F). After the detection of three pro-inflammatory cytokines, it was found that the expression of TNF-α, IL-6, and IL-1β was significantly downregulated in both Cur-Fe and CF@EM groups. It indicated that CF@EM had an inhibitory effect on the development of inflammation and was significantly better than Cur-Fe and 5-ASA (Fig. 7G).
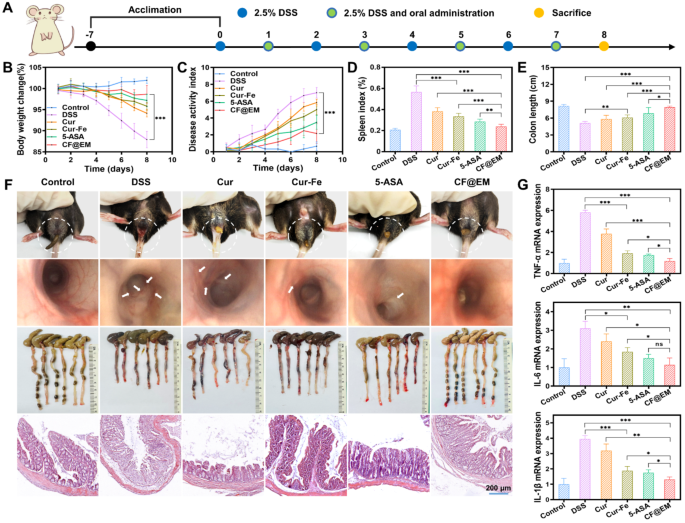
Preventive effect of CF@EM in DSS-induced colitis. (A) Schematic illustration of the establishment and treatment of DSS-induced colitis mice. (B, C) Weight change curves (B) and DAI curves (C) of mice within 8 days. (D, E) The spleen index (D) and length of the colon (E) in different treatment groups. (F) Fecal Images, endoscopic images, colon images, and H&E staining of mice in different treatment groups. (G) The mRNA expression of TNF-α, IL-6, and IL-1β in different groups. Data were expressed as the mean ± SD (n = 6). Statistical analysis was performed using a two-tailed Student’s t-test. *P P P
Modulating gut microbiota by CF@EM
The gut microbiota plays an important role in the regulation of host metabolism, immunity, and intestinal barrier function [35]. After observing the feces of mice, CF@EM was found to improve the fecal status induced by DSS. To verify its regulatory effect on the gut microbiota, we utilized 16S rRNA gene sequencing to analyze the changes. The species accumulation box plot demonstrated sufficient sample size and abundant species richness (Fig. 8A). Species diversity serves as a valuable indicator of the structural and functional characteristics of a community, comprising α-diversity and β-diversity. We analyzed α-diversity through the Shannon index and the Simpson diversity index, and β-diversity through principal component analysis (PCA). The Shannon index described the disorder and uncertainty in the occurrence of individuals among species, while the Simpson diversity index reflected the probability that two consecutive samples belong to different species. The results showed that the Shannon index and the Simpson diversity index decreased in the DSS group, indicating a decrease in α-diversity. However, treatment with CF@EM increased the reduced α-diversity caused by DSS induction, in line with the control group (Fig. 8B, S9). PCA reflects the differences in multidimensional data as distances in a two-dimensional coordinate plot by downscaling. The closer the distance in the PCA plot, the more similar the community composition of the samples. The PCA results showed that the community composition of the DSS group was different from that of the CF@EM group, suggesting that treatment with CF@EM altered the compositional structure of the gut microbiota (Fig. 8C). Further analysis of species abundance at the phylum and genus level revealed that the abundance of species in the DSS group was different from that in the CF@EM group (Fig. 8D, E). The abundance of Bacteroidetes is usually closely related to carbohydrate fermentation, nitrogen utilization, and bile acid biotransformation [36]. The abundance of Bacteroidetes was reduced after induction by DSS, and administration of CF@EM increased its abundance in the gut microbiota, with no significant difference in the CF@EM group compared to the control group (Fig. 8F).
Lactobacillus is a group of gram-positive bacteria under the Lactobacillaceae of the Firmicutes, due to the ability of Lactobacillus to improve digestion and absorption, catabolize and metabolize bile acids, enhance immunity, and inhibit inflammation [37, 38]. It is now widely studied and used in the food industry. The results showed that the abundance of Lactobacillus was significantly reduced in the DSS group, and almost all of them were inhibited. In contrast, the abundance of Lactobacillus in the CF@EM group was restored to the control level (Fig. 8G). The results also showed that the abundance of Muribaculum was downregulated by DSS induction, whereas CF@EM significantly increased its abundance and was not significantly different from the control group (Fig. 8H). However, for Clostridium-sensu-stricto and Escherichia-Shigella, two groups of pathogenic bacteria, CF@EM showed a significant inhibitory effect (Fig. S10) [39,40,41]. To further explain the observed differences in microbial composition, linear discriminant analysis effect size (LEfSe) was performed. LEfSe was used to identify and interpret high-dimensional biological information, and after identifying significantly different species by intergroup comparisons, the results were analyzed using linear discriminant analysis (LDA) to estimate the magnitude of the effect of each species’ abundance on the differential effect. Using LDA (log10) > 4 as the cutoff value, the results showed that the pathogenic Escherichia-Shigella was significantly upregulated in the DSS group, while the beneficial Lactobacillus was significantly increased in the CF@EM group (Fig. 8I, J). Taken together, the therapeutic effect of CF@EM on colitis can be partially attributed to the modulation of the gut microbiota, improving bacterial diversity, and transforming the compositional structure of the microbiota to an anti-inflammatory phenotype.
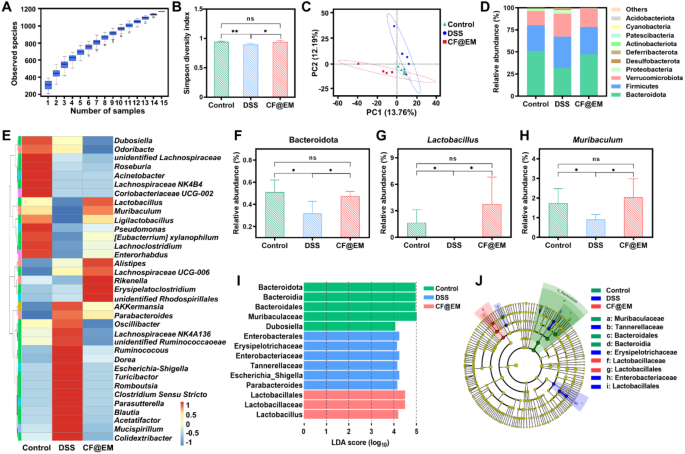
Regulation of gut microbiota by CF@EM. (A) The species accumulation boxplot. The horizontal coordinate is the number of samples, the vertical coordinate is the number of feature sequences after sampling, and the overall result reflects the rate at which new feature sequences appear under continuous sampling. (B, C) The Simpson diversity index (B) and principal component analysis (C) of the control group, DSS group, and CF@EM group. (D) The abundance at the phylum level. (E) Heatmap of the relative abundance of the 35 most abundant genus-level. (F-H) The abundance of Bacteroidetes (F), Lactobacillus (G), and Muribaculum (H). (I, J) linear discriminant analysis effect size (LEfSe) and cladogram based on LEfSe analysis. LDA (log10) > 4 was used as the cutoff value to indicate higher relative abundance in the corresponding group. In a cladogram, circles radiating from the inside out represent taxonomic levels from phylum to genus (or species). Each small circle at a different taxonomic level represents a taxon at that level, and the size of the circle diameter is proportional to the relative abundance size. Species that are not significantly different are uniformly represented in yellow, and green, blue, and red nodes indicate microbial taxa that are significant in the control, DSS, and CF@EM groups. Data were expressed as the mean ± SD (n = 5). Statistical analysis was performed using a two-tailed Student’s t-test. *P P
Regulation of gut microbial metabolism by CF@EM
Gut microbiota-host interactions are often mediated by gut microbial metabolites [42]. To further investigate the effect of CF@EM on gut microbial metabolites after regulating gut microbiota composition, we performed fecal metabolomics analysis. The PCA results showed that the metabolite composition of the DSS group was significantly altered (Fig. 9A), indicating that the metabolites of the gut microbiota were altered by the induction of DSS. By comparing the differences in metabolites between groups, which were plotted as a Venn diagram and volcano plot, it was found that there were a total of 524 differential metabolites in the control group compared with the DSS group, and 216 metabolites were significantly up-regulated and 308 were significantly down-regulated in the DSS group. While there were a total of 529 differential metabolites between the DSS group and the CF@EM group, 315 metabolites were significantly up-regulated and 214 were significantly down-regulated in the CF@EM group (Fig. 9B-D). It was found that the levels of amino acids, fatty acids and conjugates, and indoles and derivatives showed different variations in the DSS group compared to the CF@EM group (Fig. 9E-G). Gut microbiota can directly convert aromatic amino acids into indole derivatives, which can maintain intestinal homeostasis by promoting epithelial cell recovery, restoring intestinal barrier function, and modulating immune cell function [43,44,45,46]. 5-Hydroxyindole-3-acetic acid and indole-3-acrylic acid were significantly reduced in the DSS group, whereas CF@EM restored them to control levels (Fig. 9H-I). The bile acid pathway was found to be significantly enriched by KEGG enrichment analysis of differential metabolites in the DSS and CF@EM groups (Fig. 9J). Secondary bile acids including lithocholic acid and taurodeoxycholic acid were significantly reduced, which was improved by CF@EM (Fig. 9K-N). Bile acids and their derivatives have been shown to play an important role in maintaining intestinal homeostasis. Bile acids attenuate intestinal inflammation, modulate intestinal immunity, and improve intestinal barrier function [47, 48], and bile acid receptors mediate the regulation of intestinal inflammation. Bile acid metabolism is significantly dysregulated in IBD, and fecal levels of secondary bile acids are reduced in IBD patients [49, 50]. The above results suggest that the therapeutic effect of CF@EM on colitis may be inextricably linked to bile acid metabolism.
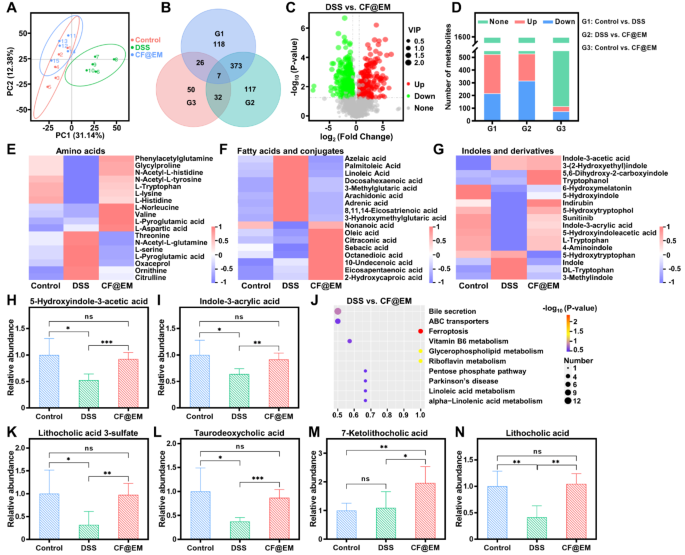
Regulation of gut microbial metabolites by CF@EM. (A) The principal component analysis of the control group, DSS group, and CF@EM group. (B) Venn diagram of differential metabolites for between-group comparison. (C) Volcano plot of DSS compared with CF@EM. (D) Metabolite changes were compared between groups (total metabolites = 1596). (E) Relative content of amino acids between control, DSS, and CF@EM groups. (F) Relative content of fatty acids and conjugates. (G-I) Relative content of indoles and derivatives (G), 5-hydroxyindole-3-acetic acid (H), and indole-3-acrylic acid (I). (J) KEGG pathway enrichment analysis of DSS compared with CF@EM. (K-N) Relative content of lithocholic acid 3-sulfate (K), taurodeoxycholic acid (L), 7-ketolithocholic acid (M), and lithocholic acid (N) between control, DSS and CF@EM groups. Data were expressed as the mean ± SD (n = 5). Statistical analysis was performed using a two-tailed Student’s t-test. *P P P


