After a customer complained that a feature of marbot, our monitoring solution for AWS was not working as expected, I started debugging the issue. First, I checked the CloudWatch alarms we use to monitor all Lambda functions. All CloudWatch alarms were in status OK, and we also had not received any alerts via Slack. Next, I analyzed the CloudWatch logs. To my surprise, I found out that one of our Lambda functions failed from time to time. I was shocked about the blind spot in our monitoring configuration.
Are you using CloudWatch alarms for Lambda function monitoring as well? Read on to ensure you avoid making the same mistake we did.

Problem
For some reason, the CloudWatch alarms we configured to get notified about failed executions of Lambda functions did not work correctly. Here is an excerpt from our CloudFormation code to configure CloudWatch alarms.
The ErrorsAlarm monitors the Error metric of the LambdaFunction. As soon as the number of errors within the past 5 minutes exceeds 0, the alarm flips to state ALARM.
LambdaFunction: |
Sounds fine. Here is the catch.
“The timestamp on a metric reflects when the function was invoked. Depending on the duration of the invocation, this can be several minutes before the metric is emitted. For example, if your function has a 10-minute timeout, then look more than 10 minutes in the past for accurate metrics.” (see Working with Lambda function metrics)
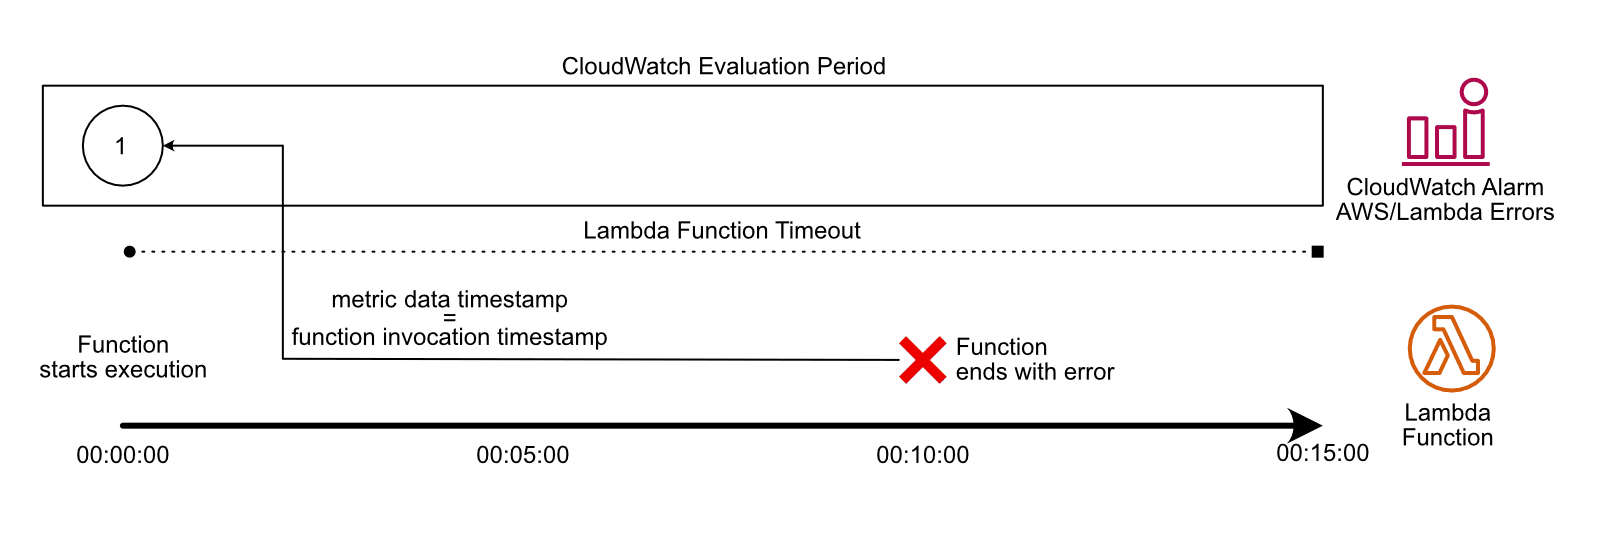
The following figure illustrates that when Lambda writes metric data, it uses the timestamp of the function invocation (start).

In our case, we set the timeout of the LambdaFunction to a maximum of 15 minutes. But the CloudWatch alarm looks back only 5 minutes. As the invocation timestamp is used when inserting a metric point into the Errors metric, the CloudWatch alarm misses errors from invocations longer than 5 minutes.
Solution
To avoid blind spots when monitoring Lambda functions with CloudWatch alarms, stick to the following rule.
CloudWatch Evaluation Period > Lambda Function Timeout |
Back to our case, we increased the evaluation period of the ErrorsAlarm to 20 minutes by increasing the evaluation periods from 1 to 4.
LambdaFunction: |
So, check the configuration of your CloudWatch alarms monitoring Lambda functions!


