


Ever wondered how prevalent credit card fraud really is in Australia? Or which age groups are most at risk? To get to the bottom of these questions, we’ve gone straight to the source: the Australian Bureau of Statistics (ABS).
The ABS provides a wealth of data on fraud victimisation, but it can be hard to understand the story behind the numbers. So let’s dissect their latest release: from state-by-state comparisons to the impact on different demographics, we’ll reveal the hard numbers behind credit card fraud. The best thing is all this data is backed by the authority of the ABS.
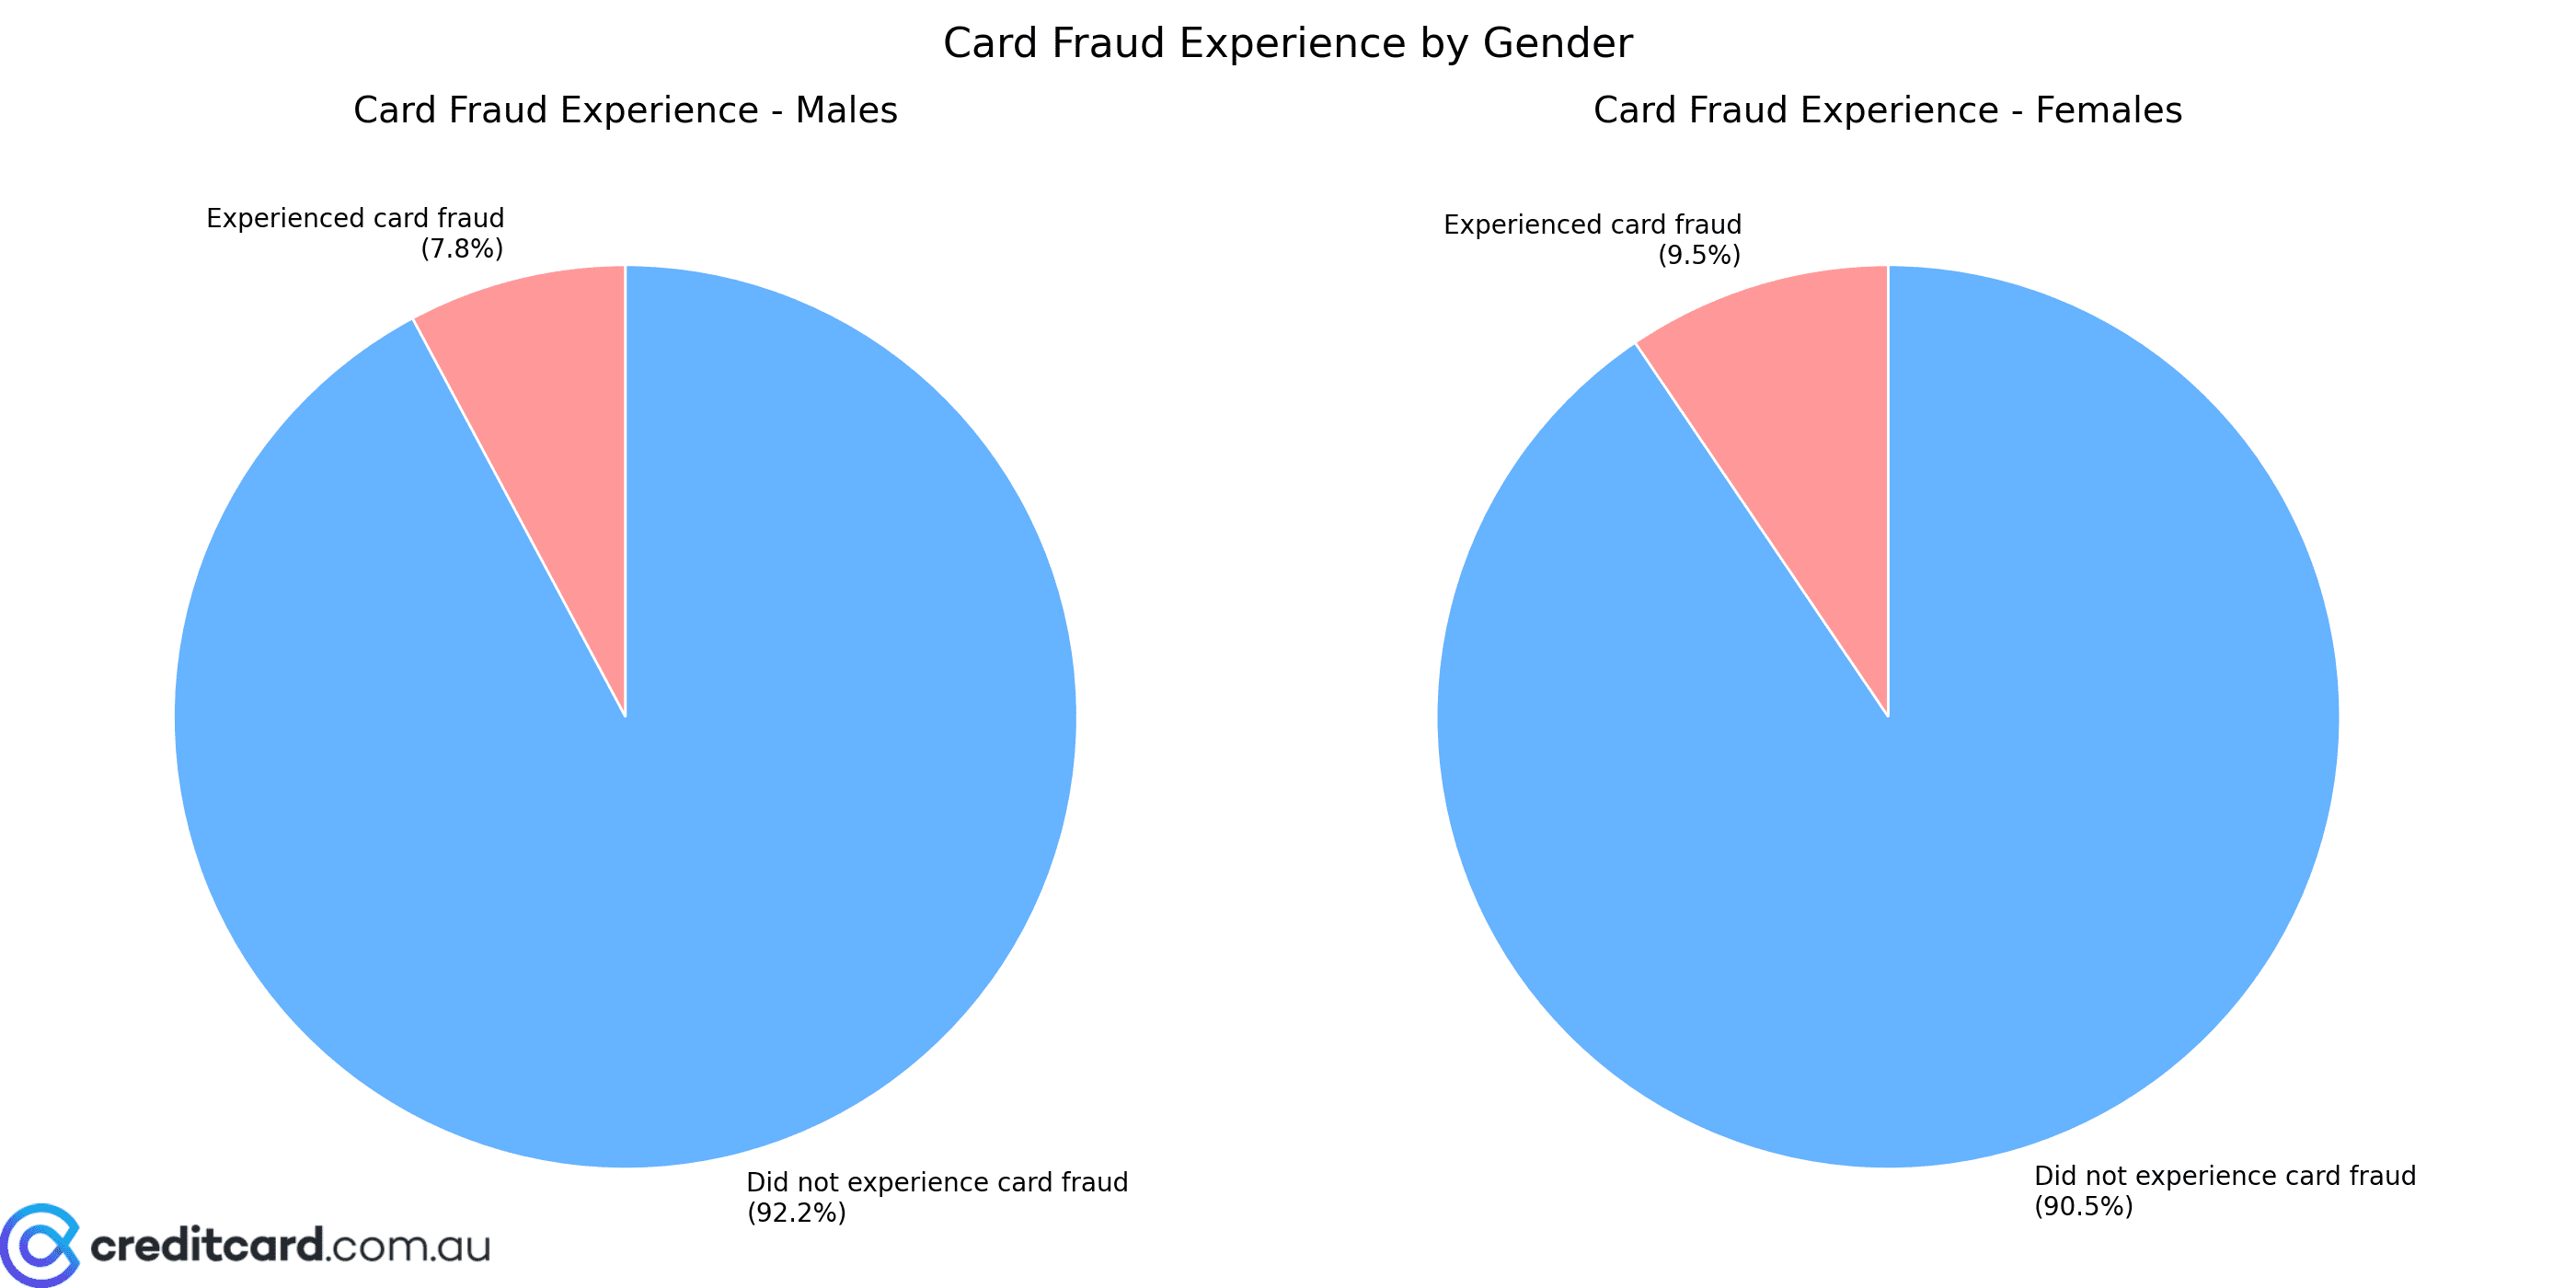
On first thought, it’s easy to assume that credit card fraud affects everyone equally. The ABS data suggests that’s not necessarily the case. When we examine the numbers by gender, we start to see some interesting differences. Males are sitting at 7.8% of the population, with females at 9.5%. But what do these percentages mean in number form? Let’s take a closer look.
 Card Fraud Experience
Experienced Fraud 
| Gender | Count |
|---|---|
Males  |
799,000 |
Females  |
1,005,700 |
Total  |
1,807,200 |
Did Not Experience Fraud 
| Gender | Count |
|---|---|
| Males |
9,428,200 |
| Females |
9,615,200 |
| Total |
19,040,700 |
When we look at those slices of the pie, there’s a very close gap. It paints the slight difference in the percentage breakdown of male and female victims.
Beyond the gender breakdown the ABS data also provides valuable insights into how card fraud victimisation varies across different Australian states. One key observation when looking at the state data is the strong correlation between population and reported card fraud incidents. The numbers scale with population which means larger states report more cases. Either way, there are still some interesting variations to explore.
Reported vs. Experienced Fraud (Australia) 
| Region | Reported Fraud | Experienced Fraud | All Persons |
|---|---|---|---|
| New South Wales | 566,100 | 577,300 | 6,567,100 |
| Victoria | 476,600 | 486,500 | 5,389,800 |
| Queensland | 372,400 | 384,800 | 4,241,000 |
| South Australia | 108,900 | 110,900 | 1,477,500 |
| Western Australia | 150,900 | 161,000 | 2,211,400 |
| Tasmania | 34,300 | 35,200 | 466,300 |
| Northern Territory | 12,800 | 13,400 | 149,500 |
| Australian Capital Territory | 37,700 | 37,900 | 357,900 |
| Australia | 1,764,000 | 1,807,200 | 20,860,100 |
The ABS data also allows us to follow the rising trend of credit card fraud over the last few years. The following graphs focuses on the time span from 2014-15 to 2022-23. We can see how the number of reported incidents has changed across Australia’s states and territories. Several economic and social factors could explain the upward trend in credit card fraud. The increase in online shopping accelerated by COVID-19 may have presented more opportunities for fraud. It’s interesting to note that Western Australia saw a decline in scams, which is refreshing to see!
Bad actors are also employing advanced techniques such as AI-powered phishing and “deepfake” scams blurring the reality between scam and reality. These are making it much harder for consumers and financial institutions to detect and prevent fraud. This increased sophistication likely plays a significant role in the growth in reported incidents.
Beyond regional differences, the ABS data also reveals significant variations in card fraud victimisation across different age groups. The data suggests that individuals in the 35-54 age range are particularly targeted by credit card fraud. This could be due to their higher online activity, greater financial assets, and susceptibility to sophisticated phishing and identity theft schemes. The 65+ demographic has a lower victimisation rate then the middle age groups, and this may be due to reluctance to report scams. Experienced Card Fraud (Last 12 Months) As we’ve seen the data from the ABS provides a pretty sobering snapshot of the current landscape. It clearly highlights the need for continuous adaptation and improvement in fraud prevention strategies. The data reveals variations across gender, region, and age. These overall numbers are concerning, but understanding these trends is the first step towards prevention. If you’d like to learn more on how to protect yourself online, you can read my guide to credit card identity theft protection. Source: ABS Personal Fraud Statistics Read more At The Credit Gardener, we are dedicated to helping you cultivate a flourishing financial future through expert credit guidance and insightful news. Our mission is to empower you with the knowledge and tools you need to navigate the complexities of credit management, ensuring you can make informed decisions that lead to financial success.
Company Trending Categories Copyright© 2024 thecreditgardener.com/ All Rights Reserved
To further illustrate the regional variations in credit card fraud, we created this interactive map of Australia. By hovering your mouse over each state or territory (or tapping the state), you can see the specific victimisation rate. You’ll be able to see a quick and visual way to compare the impact of fraud across the country. The darker the shade of red, the higher the victimisation rate.
Age Range (years)
All Persons
Victimisation Rate (%)
15—24
122,200
3.9
25—34
312,700
8.5
35—44
386,400
10.8
45—54
372,000
11.5
55—64
299,600
10
65 and over
307,500
7.2