Preparation and characterization of PTX-NPs and live M2/PTX-NPs
To improve the solubility and bioavailability of PTX, we prepared PTX-loaded PLGA nanoparticles (PTX-NPs) using an emulsification method. Scanning electron microscopy (SEM) showed that the PTX-NPs nanoparticles exhibited a homogeneous spherical morphology (Fig. 2B). Dynamic light scattering (DLS) analysis indicated that the PTX-NPs have an average diameter of 241.32 ± 3.23 nm, a zeta potential measured at -19.63 ± 0.53, and a polydispersity index of 0.13 ± 0.006, indicating uniformity in size distribution (Fig. 2C and Supplemental Table 1). High-performance liquid chromatography (HPLC) determined that the encapsulation efficiency of PTX within the PLGA nanoparticles was 87.6 ± 3.06% (Figure S1 and Supplemental Table 1).
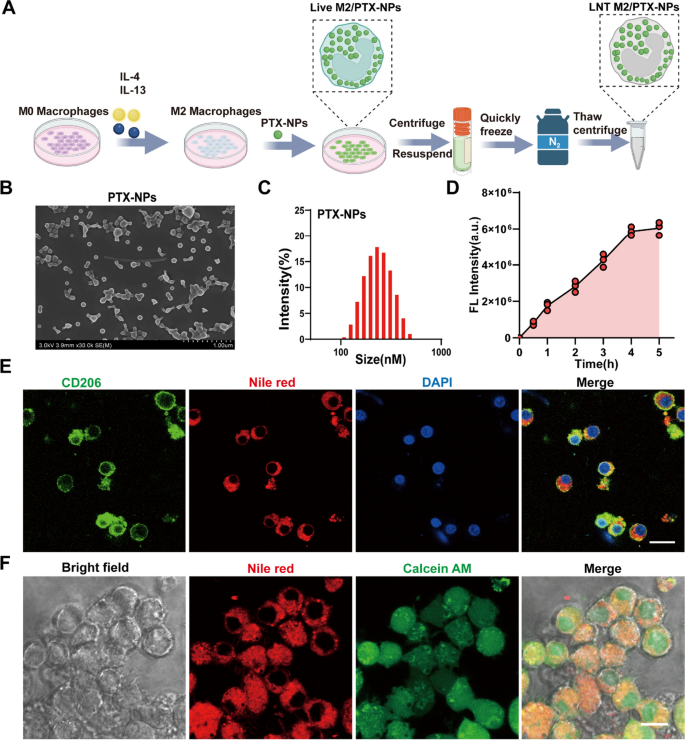
Preparation and characterization of PTX-NPs and Live M2/ PTX-NPs. A Schematic illustration of the preparation of LNT M2/PTX-NPs. B SEM images of PLGA nanoparticles loaded with PTX. C Hydrodynamic particle size distributions of PLGA nanoparticles loaded with PTX. D Quantitative analysis of fluorescence intensity reflecting the uptake of Nile red labeled PTX-NPs nanoparticles by M2 macrophages at different time points (n = 3). E Immunofluorescence staining confirmed the successful uptake of Nile red labeled PTX-NPs nanoparticles by the M2 macrophages. Scale bar 20 μm. F Cell viability of M2 macrophages, after co-incubation with Nile red labeled PTX-NPs nanoparticles, was assessed using calcein-AM. Scale bar 10um
Given the effectiveness of vesicles and cell membranes derived from M2-type macrophages in mitigating inflammation and modulating immunity within SCI, we converted NR8383 macrophages into the M2 phenotype to serve as carriers for loading our PTX-NPs nanoparticles. Flow cytometry analysis showed that after 48 h of exposure to IL-4 and IL-13, macrophages were efficiently polarized into the CD206⁺ M2 phenotype, achieving a polarization rate of 94.2% (Figure S2A). Additionally, qRT-PCR validated the successful induction of M2 polarization by revealing a notable upregulation in the expression levels of CD206, SOCS1, and Arg1 (Figure S2B–D). To track the internalization of PTX-NPs by M2 macrophages, we labeled the nanoparticles with Nile Red. Confocal microscopy revealed that PTX-NPs uptake by M2 macrophages increased progressively over 4 h and then plateaued (Figure S3 and Fig. 2D). Thus, a 4-h duration was selected as the subsequent co-incubation time. Immunofluorescence staining result clearly demonstrated the successful uptake of PTX-NPs by M2-polarized macrophages (Fig. 2E). Calcein AM staining of M2 macrophages that internalized PTX-NPs (referred to as Live M2/PTX-NPs) confirmed that the nanoparticles were primarily localized within the cytoplasm and did not affect cellular viability (Fig. 2F).
Preparation and characterization of LNT M2/PTX-NPs
To prevent the potential reversion of nano-engineered live M2 macrophages back to the M1 phenotype at the injury site, and to ensure the effective PTX release, M2 macrophages carrying PTX-NPs were treated with liquid nitrogen for 24 h (Fig. 2A). Subsequently, they were washed with PBS to obtain the LNT M2/PTX-NPs. SEM images revealed that liquid nitrogen treatment caused the disappearance of filopodia on live M2 macrophages, resulting in a rougher cell surface (Fig. 3A). The transmission electron microscopy (TEM) images of LNT M2/PTX-NPs clearly show that PTX-NPs are internalized by M2 macrophages and located in the cytoplasm (Fig. 3B). Notably, almost all LNT M2/PTX-NPs cells were positively stained with propidium iodide (PI) and not with calcein AM, indicating cell death (Fig. 3C). Subsequent analysis via a CCK-8 cell viability assay reinforced the finding that LNT M2/PTX-NPs, post-liquid nitrogen processing, exhibited an absence of proliferative capacity (Fig. 3D). Additionally, a minor reduction in the diameter of LNT M2/PTX-NPs relative to their precursor was identified (Fig. 3E). LNT M2/PTX-NPs exhibited a lower zeta potential compared to their precursors, live M2 macrophages enveloping PTX loaded nanoparticles (Live M2/PTX-NPs), likely a result of membrane wrinkling and increased permeability caused by liquid nitrogen treatment (Fig. 3F). Through 5 days of morphological observation and particle size analysis, we found that LNT M2/PTX-NPs displayed high stability, which also lays the foundation for the sustained release of PTX (Fig. 3G). Upon cytoskeletal staining with phalloidin, it was observed that LNT M2/PTX-NPs cells preserved cellular structures akin to those of their precursors-Live M2/PTX-NPs (Fig. 3H). Using HPLC analysis, we found that the PTX content in our cryo-shocked macrophage biomimetic drug delivery system was approximately 12 μg per million units of both live M2/PTX-NPs and LNT M2/PTX-NPs (Supplemental Table 2). Further, we aimed to explore whether liquid nitrogen treatment affects the expression of proteins on the cell membrane. Sodium Dodecyl Sulphate–Polyacrylamide Gel Electrophoresis (SDS-PAGE) analysis revealed that the protein profiles of LNT M2 (liquid nitrogen-treated M2 macrophages) and LNT M2/PTX-NPs closely resembled those of live M2 macrophages, indicating that the majority of proteins were preserved (Figure S4). Subsequently, the biomedical safety of LNT M2/PTX-NPs on microglial and neuronal cell lines was evaluated using the CCK-8 assay. LNT M2/PTX-NPs exhibited no effect on the viability of PC12 and BV-2 cells following 24 h of incubation, even at elevated concentrations (1.0 × 10⁷ units mL⁻1), as shown in Figure S5.
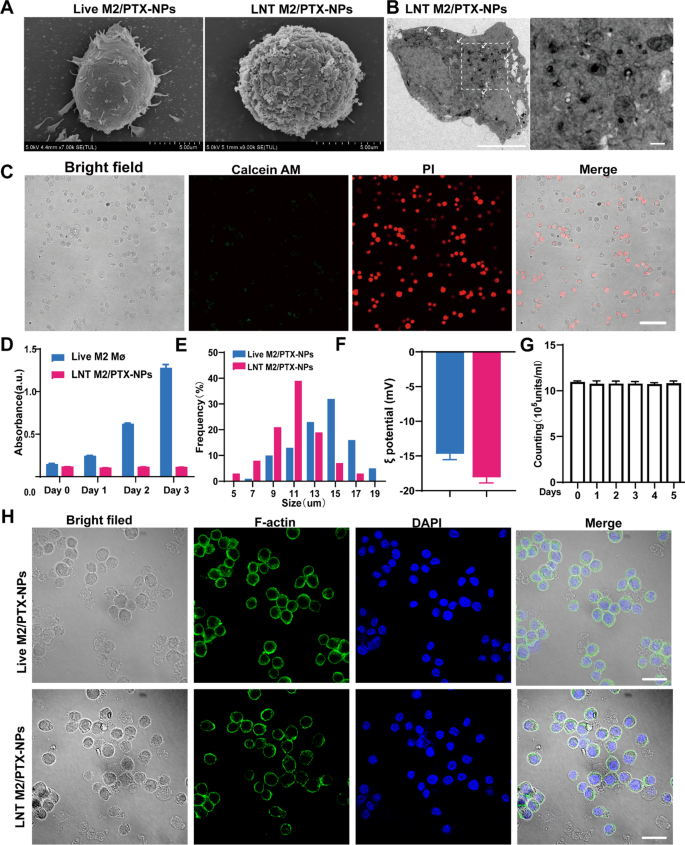
Preparation and characterization of LNT M2/PTX-NPs. A Typical SEM images of live M2//PTX-NPs cells and LNT M2/PTX-NPs. Scale bars 5um. B TEM images indicate that PTX-NPs are internalized and located in the cytoplasm of macrophages. Scale bars 5um. The scale bar for enlarged images is 500 nm. C Viability assessment of LNT M2/PTX-NPs conducted using the Calcein AM/PI staining. Calcein AM: live cells; Propidium Iodide: dead cells. Scale bar represents 50 μm. D Cell viability analysis of live M2 and LNT M2/PTX-NPs by CCK-8 (n = 3). E Particle size distribution of LNT M2/PTX-NPs and its precursors. F The zeta-potential of LNT M2/PTX-NPs and its precursor (n = 3). G The stability of LNT M2/PTX-NPs was evaluated by monitoring its quantitative changes in PBS (37 °C) by cell counting (n = 3). H Structural composition of LNT M2/PTX-NPs and its precursor, with the cell nucleus highlighted using DAPI (blue) staining, and the cytoplasmic F-actin marked by AF488 phalloidin (green). Scale bar 20um
In Vitro proinflammatory cytokine and chemokine removal effect of LNT M2
Following SCI, an inflammatory cytokine storm and the extensive infiltration of immune cells precipitate a sustained inflammatory state and subsequent neurodegeneration [27,28,29]. Mitigating this inflammation and reducing immune cell infiltration is crucial for repairing the SCI-affected immune microenvironment.
As previously shown, LNT M2/PTX-NPs retain a majority of proteins from their precursor cells, prompting us to further investigate the retention of cytokines receptors and chemokines receptors. Western blot (WB) results showed that cytokine binding receptors (including IL-R2 for binding IL-1β, CD126 and CD130 for binding IL-6, CD120a and CD120b for binding TNF-α) and the chemokine receptor CCR2(which binding CCL2) were well preserved, with slight reductions in expression levels (Fig. 4A). Confocal microscopy also showed clear labeling of CCR2 and CD120a on LNT M2/PTX-NPs, albeit with slightly lower fluorescence intensity than their precursors (Fig. 4B–C).
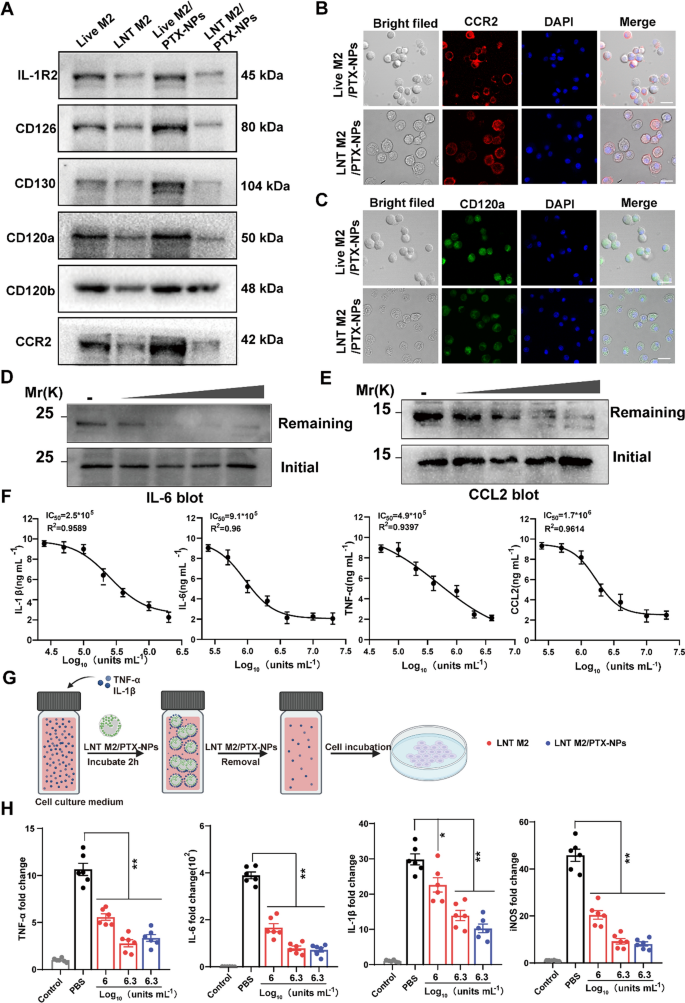
The adsorption effect of LNT M2/PTX-NPs as a nano-decoy on inflammatory/chemotactic factors. A Representative protein expression of cytokine/chemokine receptors on LNT M2, LNT M2/PTX-NPs and their precursors were detected using western blotting. CCR2 (B) and CD120a (C) expression on Live M2/PTX-NPs cells and LNT M2/PTX-NPs were labeled with immunofluorescence staining and observed by confocal microscopy. Scale bar 20um. Immunoblotting analysis of the residual amounts of D IL-6 and E CCL2 after incubation with gradient concentrations of LNT M2/PTX-NPs (5 * 105 units mL−1, 1 * 106 units mL−1, 2 * 106 units mL−1, 4 * 106 units mL−1 respectively). F The adsorption effect of LNT M2/PTX-NPs to inflammatory factors (IL-1β, IL-6, TNF-α) and chemokines (CCL2) was evaluated through ELISA. The y-axis indicating the concentrations of cytokines/chemokines left after exposure to LNT M2/PTX-NPs (n = 6). G An illustration depicting the process of cell stimulation using a culture medium infused with TNF-α and IL-1β. Prior to the incubation, the medium is treated with LNT M2 or LNT M2/PTX-NPs, which are subsequently eliminated through centrifugation. H The mRNA expression levels of TNF-α, IL-1β, IL-6, and iNOS in primary microglia cells were measured using qRT-PCR (n = 6). Error bars represent the SEM. p value: *p < 0.05, **p < 0.01
To verify the functionality of these receptors, we introduced increasing amounts of LNT M2/PTX-NPs into PBS solutions containing TNF-α and CCL2, allowing interaction for 2 h. Western blot analysis showed that, after removal of LNT M2/PTX NPs, the residual levels of TNF-α and CCL2 decreased with increasing LNT M2/PTX-NPs, indicating dose-dependent adsorption of these inflammatory factors (Fig. 4D, E).
We further validated this adsorption effect using ELISA, which demonstrated that LNT M2/PTX-NPs could dose-dependently adsorbed IL-1β, IL-6, TNF-α, and CCL2 (Fig. 4F). The IC50 values for the clearing effects of LNT M2/PTX-NPs on IL-1β, IL-6, TNF-α, and CCL2 were 2.5 × 10⁵ units/mL, 9.1 × 10⁵ units/mL, 4.9 × 10⁵ units/mL, and 1.7 × 10⁶ units/mL, respectively (Fig. 4F). Consequently, these results confirm that the receptors on LNT M2/PTX-NPs are functional, suggesting they can neutralize pro-inflammatory cytokines and inhibit excessive chemotaxis of peripheral immune cells post-injury.
Given the role of microglia activation and transformation into the pro-inflammatory M1 phenotype in mediating neural inflammation after SCI [30], we evaluated whether LNT M2/PTX-NPs could inhibit this activation (Fig. 4G). IL-1β and TNF-α containing cell culture medium were pre-inculcated with LNT M2 or LNT M2/PTX-NPs for 2 h, then the supernatant was introduced to microglial cultures. After 24 h, qRT-PCR showed that microglia in the PBS group significantly shifted towards the M1 phenotype with upregulated expression of TNF-α, IL-6, IL-1β, and iNOS (Fig. 4H). Notably, LNT M2 or LNT M2/PTX-NPs treatment significantly inhibited this phenotypic transformation, showing a marked downregulation of these inflammatory markers (Fig. 4H). Together, this result suggests that LNT M2/PTX-NPs exhibit significant neutralization efficiency across multiple cytokines and inhibits microglial M1 phenotype activation induced by cytokines.
LNT M2/PTX-NPs@Gel facilitates neural function recovery in SCI rats
Gelatin Methacryloyl (GelMA) hydrogels, enriched with cell-adhesive RGD peptides, exhibit structural stability, biocompatibility, and injectability, making them ideal for biomedical applications such as tissue engineering and drug delivery [31,32,33,34,35,36]. Specifically, GelMA demonstrates unique advantages in the treatment of SCI, where it can fill the cavities formed post-injury, ensuring direct delivery of various bioactive substances to the lesion site [37, 38]. Its porous structure allows for the free movement of substances such as oxygen, nutrients, and inflammatory/chemotactic factors within its matrix [39, 40].
In this study, we used GelMA as the structural platform to deliver cryo-shocked M2 macrophages to spinal cord injury sites. We prepared injectable LNT M2/PTX-NPs-loaded hydrogels (LNT M2/PTX-NPs@Gel) by mixing LNT M2/PTX-NPs with GelMA solution and irradiating it with 405 nm UV light for 30 s. Additionally, PTX-NPs encapsulated in GelMA (PTX-NPs@Gel) and LNT M2 encapsulated in GelMA (LNT M2@Gel) were prepared using the same method. The SEM images illustrated that PTX-NPs@Gel, LNT M2@Gel, and LNT M2/PTX-NPs@Gel all possessed a typical uniform and interconnected porous network, with the hydrogel pore sizes and structures showing no significant variation upon the incorporation of PTX-NPs, LNT M2, or LNT M2/PTX-NPs (Figure S6A). Confocal microscopy showed uniform distribution of LNT M2/PTX-NPs within the hydrogel matrix (Figure S6B). In vitro drug release studies indicated a slow, sustained release of PTX for up to 1 month (Figure S6C). Owing to the particularity of the SCI site, our delivery system exhibits notable advantages due to its slow-release feature following a single administration. The biocompatibility of Gel, PTX-NPs@Gel, LNT M2@Gel, and LNT M2/PTX-NPs@Gel was further confirmed through CCK-8 cell viability assays, live/dead staining, and hemolysis tests, showing minimal cytotoxicity (Figure S7).
We further evaluated the therapeutic efficacy of our system by injecting Gel, PTX-NPs@Gel, LNT M2@Gel, and LNT M2/PTX-NPs@Gel into the injured spinal cords of rats. BBB analysis indicated significant motor function improvement in the PTX-NPs@Gel and LNT M2@Gel groups 3 weeks post-treatment, while rats in the LNT M2/PTX-NPs @Gel group showing notable improvements 2 weeks post-treatment (Fig. 5A). It is noteworthy that within the LNT M2/PTX-NPs group, 3 out of 11 rats presented with continuous plantar placement with support and coordinated hindlimb movements, achieving BBB scores above 10, a condition not observed in any other group (Fig. 5B). Footprint analysis revealed that rats in the LNT M2/PTX-NPs@Gel group exhibited the most significant locomotor improvement (Fig. 5C). PTX-NPs@Gel and LNT M2@Gel groups showed moderate improvement, while Gel and Control groups exhibited continued hind limb dragging (Fig. 5C). This finding was further substantiated by photographic evidence of the hind limbs in each group (Fig. 5F). Electrophysiological analysis showed significant enhancements in the Motor Evoked Potential (MEP) amplitudes in the PTX-NPs@Gel, LNT M2@Gel, and LNT M2/PTX-NPs@Gel groups relative to the Control group (Fig. 5D and E). The LNT M2/PTX-NPs@Gel group exhibited superior MEP amplitude improvements relative to the other treatment groups (Fig. 5D and E). In summary, the above findings suggest that LNT M2/PTX-NPs@Gel facilitates motor function recovery after SCI and exerts significant neuroprotective effects.
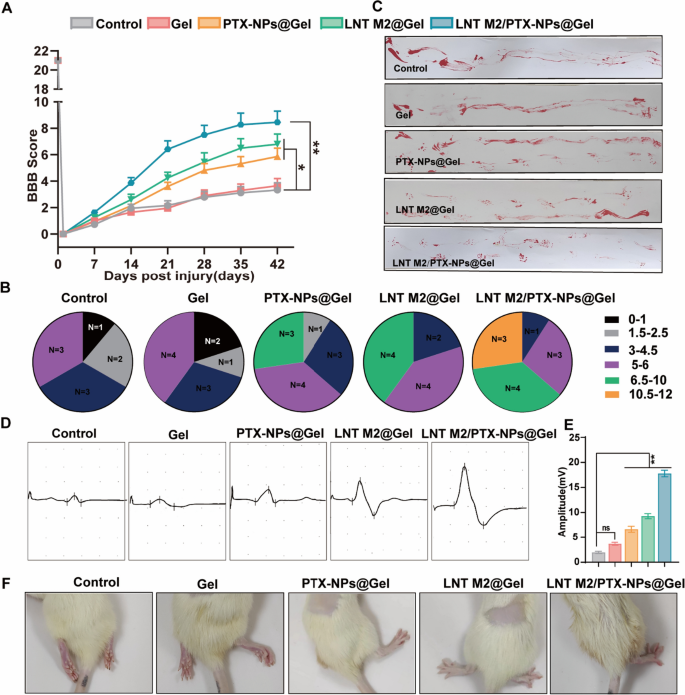
The locomotor functional recovery of SCI rats underwent LNT M2/PTX-NPs@Gel treatment. A The BBB scoring in SCI rats over a period of 6 weeks following various treatments (n ≥ 9). B Distribution of BBB locomotion scores in different treatment groups at 6 weeks post-injury. C Footprint analysis evaluating the restoration of hindlimb motor function in SCI rats at the 6 weeks post-injury. D Electrophysiological assessment of spinal cord injured rats using MEP 6 weeks post-treatment. E Quantification of the motor evoked potentials (MEP) amplitudes (n = 6). F Representative images of hind limbs of spinal cord injured rats 6 weeks after treatment. Error bars represent the SEM. p value: “ns” means no significant difference, *p < 0.05, **p < 0.01
Remodeling the spinal cord immune microenvironment with LNT M2/PTX-NPs@Gel in SCI rats
LNT M2/PTX-NPs demonstrated in vitro capability as a nano-decoy for the elimination of inflammatory/chemotactic factors, with this effect remaining comparable after incorporation into Gel (Figure S8). Therefore, we further investigated its inflammatory regulation efficacy in vivo using an SCI rat model. WB results revealed a significant suppressed expression of CD68 and the M1 macrophage/microglia marker iNOS in the LNT M2@Gel and LNT M2/PTX-NPs@Gel group, compared to the Control group (Fig. 6F–H). Additionally, a significant increase in the expression of the M2 microglia marker Arg-1 was observed in LNT M2@Gel and LNT M2/PTX-NPs@Gel group (Fig. 6F and I). The expression of phosphorylated p65 (p-P65), which promotes the production of inflammation, was also significantly inhibited in the LNT M2@Gel and LNT M2/PTX-NPs@Gel treatment groups (Fig. 6F and J).
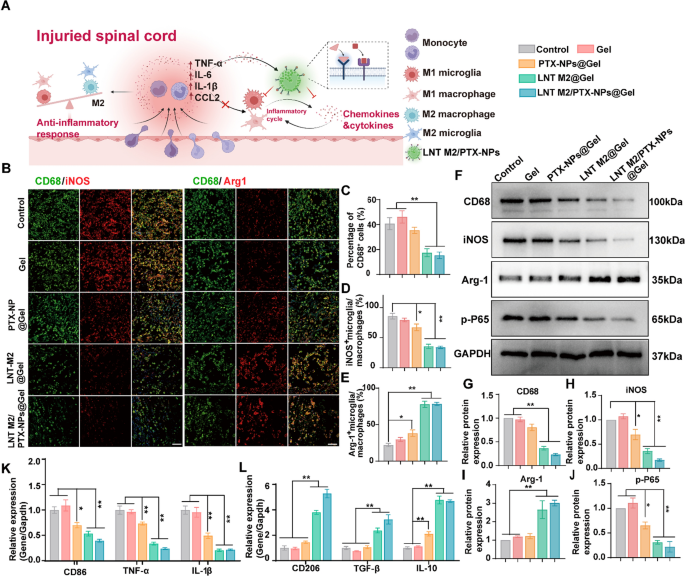
LNT M2/PTX-NPs@Gel attenuate neuroinflammation by inhibiting the infiltration of immune cells and shift M1/M2 polarization in SCI rats. A Schematic diagram illustrates the mechanism of LNT M2/PTX-NPs in inhibiting infiltration of immune cells and modulating M1/M2 polarization. B Immunofluorescence co-staining of CD68 (green) with iNOS (red) and Arg1 (red) in SCI rats with different treatments at 7 days post-injury. Scale bar 50 μm. C Quantitative analysis of CD68+ microglia/macrophage infiltration in the injury site of SCI rats with different treatments (n = 4). Quantitative analysis of immunofluorescence staining for the proportion of iNOS + microglia/macrophages (D) and Arg-1 + microglia/macrophages (E) in Figure B (n = 4). F Western blotting analysis of CD68, iNOS, Arg-1, and p-P65 expression in spinal cord lesion areas at 7 days after injury. G–J Quantitative analysis of CD68, iNOS, Arg-1, and p-P65 protein expression in F (n = 3). mRNA expression levels of (K) M1 type markers (CD86, TNF-α, IL-1β) and L M2 type markers (CD206, TGF-β, IL-10) in SCI rats with different treatments were analyzed by qRT-PCR (n = 6). Error bars represent the SEM. p value: *p < 0.05, **p < 0.01
To assess the infiltration of immune cells and the polarization states of microglia/macrophages in treatment groups, we further implemented immunofluorescence co-staining of CD68 with iNOS and Arg1, respectively. The results showed that LNT M2@Gel and LNT M2/PTX-NPs@Gel administration significantly reduced CD68-positive cells, indicating suppressed immune cell infiltration (Fig. 6B, C). This suppression likely results from the adsorption of chemotactic factors by receptor on the cryo-shocked M2 macrophages (Fig. 6A). There was a marked reduction in the proportion of iNOS+ cells in LNT M2@Gel and LNT M2/PTX-NPs@Gel groups suggested a diminished proportion of M1 phenotype microglia/macrophages at the lesion site (Fig. 6B and D). qRT-PCR analyses confirmed this by showing significant downregulation in the expression of M1-associated genes (CD86, TNFα, IL-1β) (Fig. 6K). Conversely, there was an increase in Arg1+ cells, indicating an elevated proportion of M2 phenotype microglia/macrophages in the LNT M2@Gel and LNT M2/PTX-NPs@Gel groups (Fig. 6B and E). This was further substantiated by the upregulation of M2-specific genes (CD206, TGF-β, IL-10) (Fig. 6L).
In conclusion, our results indicate that LNT M2/PTX-NPs@Gel inhibits inflammatory infiltration and modulates the balance between anti-inflammatory and pro-inflammatory phenotypes post-SCI through the adsorption action of receptors retained on the membrane of cryo-shocked M2 macrophages.
LNT M2/PTX-NPs@Gel enhances axonal regeneration in rats with SCI
Functional recovery after SCI is largely determined by the regeneration of damaged axons and the formation of new synaptic connections [41, 42]. Therefore, immunofluorescence staining for neurofilament protein (NF-200) and microtubule-associated protein 2 (MAP2) was employed to examine nerve growth and axon regeneration in different treatment groups. The Control and Gel-only groups displayed negligible NF-200 and MAP2 staining at the center of injury (Fig. 7A–D). PTX-NPs@Gel and LNT M2@Gel implanted groups showed a marked increase in NF-200 and MAP2 staining within the injured regions, suggesting enhanced axonal regeneration (Fig. 7A–D). Previous studies have indicated that inflammatory cytokines promote the activation of astrocytes, which in turn facilitates the formation of glial scars, thereby impeding neural regeneration in the injured area [43,44,45]. We speculate that the axonal regenerative effect of LNT M2 is attributed to its significant anti-inflammatory properties. The combination of PTX and LNT M2 demonstrated a synergistic effect, with a significant infiltration of NF200+ axons into the lesion area in the LNT M2/PTX-NPs@Gel group, and regenerative axonal fibers filling the entire lesion area, almost completely bridging the two damaged ends (Fig. 7A and C). Similarly, the density of MAP2-positive neurons within the lesion area of the LNT M2/PTX-NPs@Gel group significantly exceeded that of other groups (Fig. 7B and D). Western blot analysis for NF200 and MAP2 expression further corroborated these observations (Fig. 7E–G). Overall, the findings demonstrate that implantation of our cryo-shocked M2 macrophage based multifunctional scaffold significantly promotes neural regeneration in SCI rats.
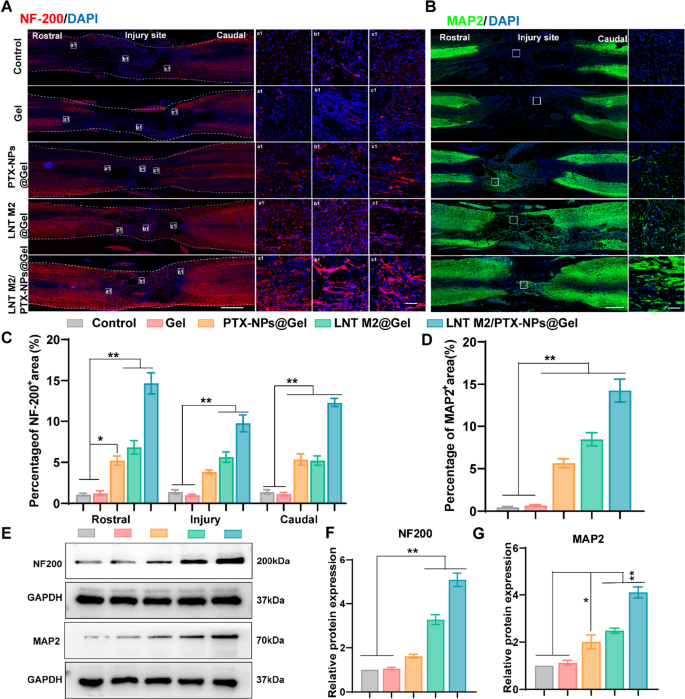
LNT M2/PTX-NPs@Gel promotes axonal regeneration in the injured spinal cord. A Representative immunostaining images of NF200 (red) for SCI and each treatment group at 6 weeks post-injury, including local images of the rostral border (a1), epicentral (b1), and caudal border (c1) boundaries of the injured spinal cord. Scale bar = 1000um. The scale bar for enlarged images is 50 μm. B Representative immunostaining images of MAP2 (green) for SCI and each treatment group at 6 weeks after injury. Scale bar = 1000um. The scale bar for enlarged images is 50 μm. C Quantification of NF200 (red) positive signals in rostral, epicentral, and caudal of the lesion area (n = 4). D Quantification of MAP2 positive signals (green) in the lesion area (n = 4). E–G Western blotting and quantitative analysis of NF200 and MAP2 expression levels in spinal cord lesion area in different groups (n = 3). Error bars represent the SEM. p value: *p < 0.05, **p < 0.01
LNT M2/PTX-NPs@Gel implantation reduces scar formation in rats with SCI
Following SCI, activated astrocytes progressively accumulate around the injury core, forming glial scars [46]. These glial scars act as a natural barrier and simultaneously secrete inhibitors of neural regeneration such as CSPG, thus hindering axonal regeneration post-SCI [47]. Additionally, fibroblasts proliferate, migrate, and gather at the injury core to form fibrotic scars constitute another significant cause of axonal regeneration failure and functional deficits [48, 49]. We used GFAP (astrocyte marker) to characterize glial scar formation and CS56 to denote CSPG in the lesion area. Fibronectin, a key component of fibrotic scars, was also characterized by immunofluorescence staining. Extensive CS56 and Fibronectin signals were observed in the injury areas of the Control and Gel-treated groups, along with widespread GFAP-positive reactive astrocytes around the injury edge (Fig. 8A–D and Figure S9).
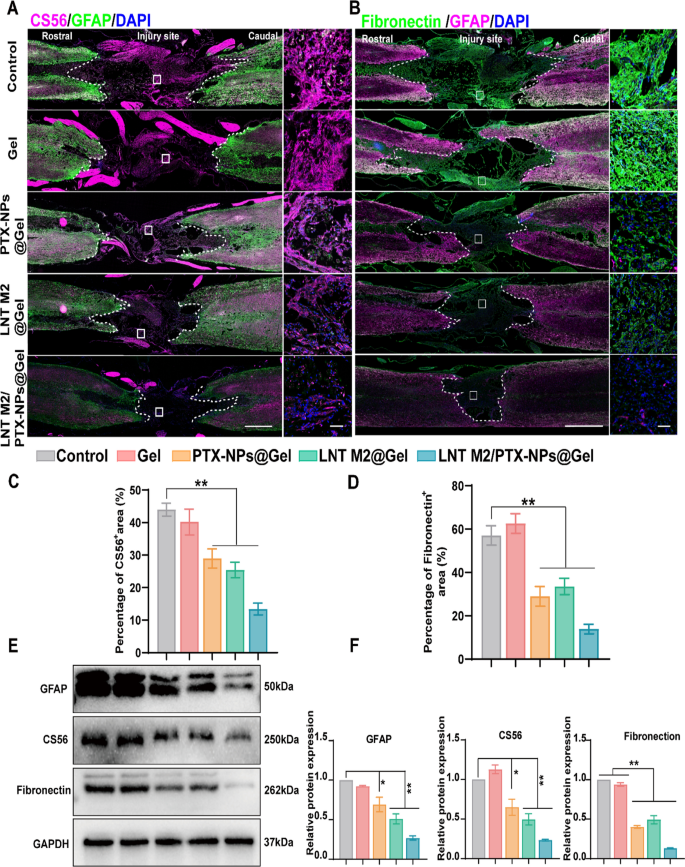
LNT M2/PTX-NPs@Gel inhibited glial and fibrous scar formation following SCI. A GFAP/CS56 immunofluorescence co-staining was employed to depict the deposition of glial scar components at the injury site. Scale bar = 1000um. The scale bar for enlarged images is 50 μm. B GFAP/Fibronectin immunofluorescence co-staining was employed to depict the fibronectin-positive fibrotic scar components at the injury site. Scale bar = 1000um. The scale bar for enlarged images is 50um. Quantitative analysis of CS-56 (C) and Fibronectin (D) positive signals in each group (n = 3). E, F Western blotting and quantitative analysis of GFAP, CS56 and Fibronectin expression levels in spinal cord lesion area in different groups (n = 3). Error bars represent the SEM. p value: *p < 0.05, **p < 0.01
PTX administration was observed to inhibit glial scar formation and reduce the deposition of CSPG, which is largely in accordance with previous reports (Fig. 8A, C and Figure S9) [23]. Similarly, LNT M2 significantly reduced glial scar formation and CSPG deposition, as evidenced by much weaker signals of both GFAP and CS56 in LNT M2@Gel group (Fig. 8A, C and Figure S9). In addition, implantation of PTX or LNT M2 at the lesion site also significantly reduced fibrotic scar density (Fig. 8B and D). Furthermore, the combined use of PTX and LNT M2 showed a synergistic effect, leading to the lowest expression of CSPG, fibronectin, and GFAP in the LNT M2/PTX-NPs@Gel group, indicating an enhanced suppression of both glial and fibrotic scar formation (Fig. 8A–D and Figure S9). Results from western blot analyses were consistent with the data obtained by IF, further confirming our findings (Fig. 8E, F). In conclusion, the cryo-shocked M2 macrophages-loaded scaffold we developed, leveraging the combined effects of PTX and LNT M2, significantly suppresses glial scar hyperplasia and prevents fibrotic scars deposition in the lesion area.
In vivo biocompatibility assessment
To assess in vivo biocompatibility, histological analyses of major organs and blood tests were performed at the 6 weeks post-injury. As anticipated, histological analysis revealed no significant damage to the major organs, and there were no increases in alanine aminotransferase (ALT), aspartate transaminase (AST), blood urea nitrogen (BUN), or creatinine (CRE) levels in any of the groups. (Figure S10). Together, these results suggest satisfactory biocompatibility of the implant hydrogels in vivo.
Comprehensive evaluation of LNT M2/PTX-NPs@Gel in SCI treatment using bioinformatics
To further investigate the mechanisms by which our cryo-shocked macrophage derived scaffold aids in the neural functional recovery of SCI rats, transcriptomic analyses were conducted. A total of 1501 differentially expressed genes were identified (absolute Fold change ≥ 1.5, p < 0.05), with 682 genes upregulated and 819 downregulated following treatment with LNT M2/PTX-NPs@Gel (Fig. 9A, B). Gene Ontology (GO) analysis revealed that treatment with LNT M2/PTX-NPs@Gel decreased inflammation-related signaling pathways. Specifically, compared with the Control group, the down-regulated genes in the LNT M2/PTX-NPs@Gel treatment group were enriched in immune system process, immune response, regulation of immune system process, cellular response to chemical stimulus, and leukocyte activation (Fig. 9C). This observation is highly consistent with our in vitro and in vivo results, demonstrating that LNT M2/PTX-NPs@Gel mitigates neuroinflammatory responses and curtails the infiltration of inflammatory cells. Notably, genes upregulated in LNT M2/PTX-NPs@Gel group were enriched in pathways related to neurofunctional regulation, such as synapse, neuron projection, axon, synaptic signaling, chemical synaptic transmission, anterograde trans-synaptic signaling, nervous system development, neuronal cell body, regulation of neurotransmitter levels, and neurotransmitter transport (Fig. 9D). These findings also validate our previous results regarding the neuroprotective properties and axonal regeneration promotion by LNT M2/PTX-NPs@Gel.
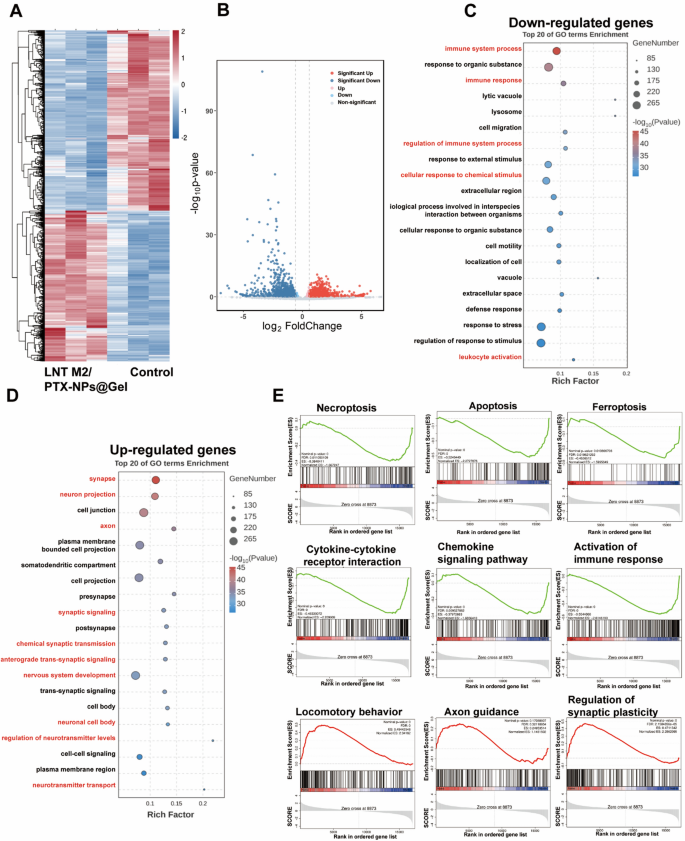
Major transcriptional changes in SCI rats with LNT M2/PTX-NPs@Gel treatment. A Heatmap and volcano plot (B) showing differentially expressed genes in the spinal cord lesion area between the Control group and the LNT M2/PTX-NPs@Gel treatment group (Fold change > 1.5 and p value < 0.05). GO analysis of downregulated genes (C) and up-regulated genes (D) in the spinal cord lesion area from Control and LNT M2/PTX-NPs@Gel treatment group. E Gene set enrichment analysis (GSEA) showing enrichment of genes sets involved in necroptosis, apoptosis, ferroptosis, cytokine-cytokine receptor interaction, chemokine signaling pathway, activation of immune response, locomotory behavior, axon guidance, regulation of synaptic plasticity in LNT M2/PTX-NPs@Gel group compared to Control group
Gene set enrichment analysis (GSEA) revealed that, compared to the Control group, the LNT M2/PTX-NPs@Gel group showed downregulation of genes involved in necrosis (ES = − 0.38), apoptosis (ES = − 0.52), and ferroptosis (ES = − 0.45), indicating that LNT M2/PTX-NPs@Gel has a protective effect against neural death (Fig. 9E). Additionally, a series of genes related to cytokine-cytokine receptor interaction (ES = − 0.48), chemokine signaling pathway (ES = − 0.38), and activation of immune response (ES = − 0.55) were downregulated in the LNT M2/PTX-NPs@Gel group compared with the Control group, confirming its effects in inhibiting neuroinflammation (Fig. 9E). LNT M2/PTX-NPs@Gel group exhibited upregulated expression of genes involved in locomotory behavior (ES = 0.49), axon guidance (ES = 0.25), and regulation of synaptic plasticity (ES = 0.47), highlighting its potential in supporting motor function recovery (Fig. 9E). These mRNA sequencing results support our experimental findings, demonstrating that LNT M2/PTX-NPs@Gel exhibits anti-neuroinflammatory effects and exerts neuroprotective actions in rats with SCI.


